Carbon dioxide (CO2) emissions have been the subject of discussions for many years. Specifically, CO2 emissions are believed to have a significant negative impact on the environment we all share. In order to reduce the negative impact of the environment, a great deal of focus has been placed on energy sourcing; that is, the way in which we try to source more energy production from alternative production methods, such as wind and solar power, rather than the traditional fossil fuels. While these efforts must continue, here at 2by2 we believe that too little emphasis has been put on energy productivity; that is, how much energy we consume in order to fuel additional growth.
At 2by2, we are strong believers in the liberated forces of economy, both on an aggregated national level (macro) as well as in individual markets and sectors (micro). Consequently, we would like to encourage business leaders and entrepreneurs to take on the challenge of fueling energy-light economic growth in the future, with a dramatic increase in energy productivity. We believe that this effort is essential in order to secure a sustainable development, but we also believe that it can turn out to be a competitive advantage for those who deliver on it.
CO2 emission – current situation
Carbon dioxide (CO2) emission is a direct byproduct of the way we live our daily lives; specifically, it is a byproduct of burning fossil fuels, including carbon dioxide produced during consumption of solid, liquid, and gas fuels, and gas flaring.
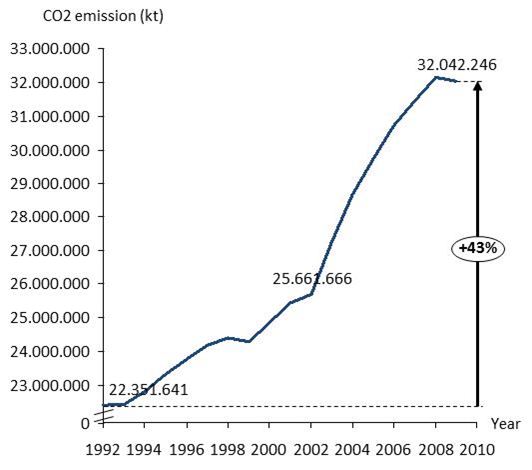
If CO2 emissions have a negative environmental impact, it is essential to understand and follow how the emissions develop. There is no doubt that emissions have increased tremendously over the last 50 years.
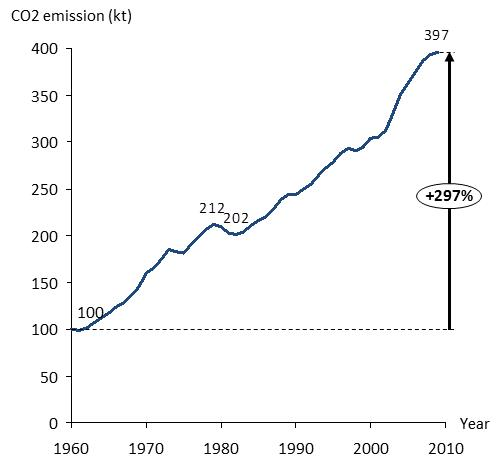
One hundred and fifty countries have been reporting CO2 emissions since 1960. The total aggregated emissions have increased by an incredible 297 percent between 1960 and 2008. The only real decline, albeit temporary, can be observed between 1979 and 1982.
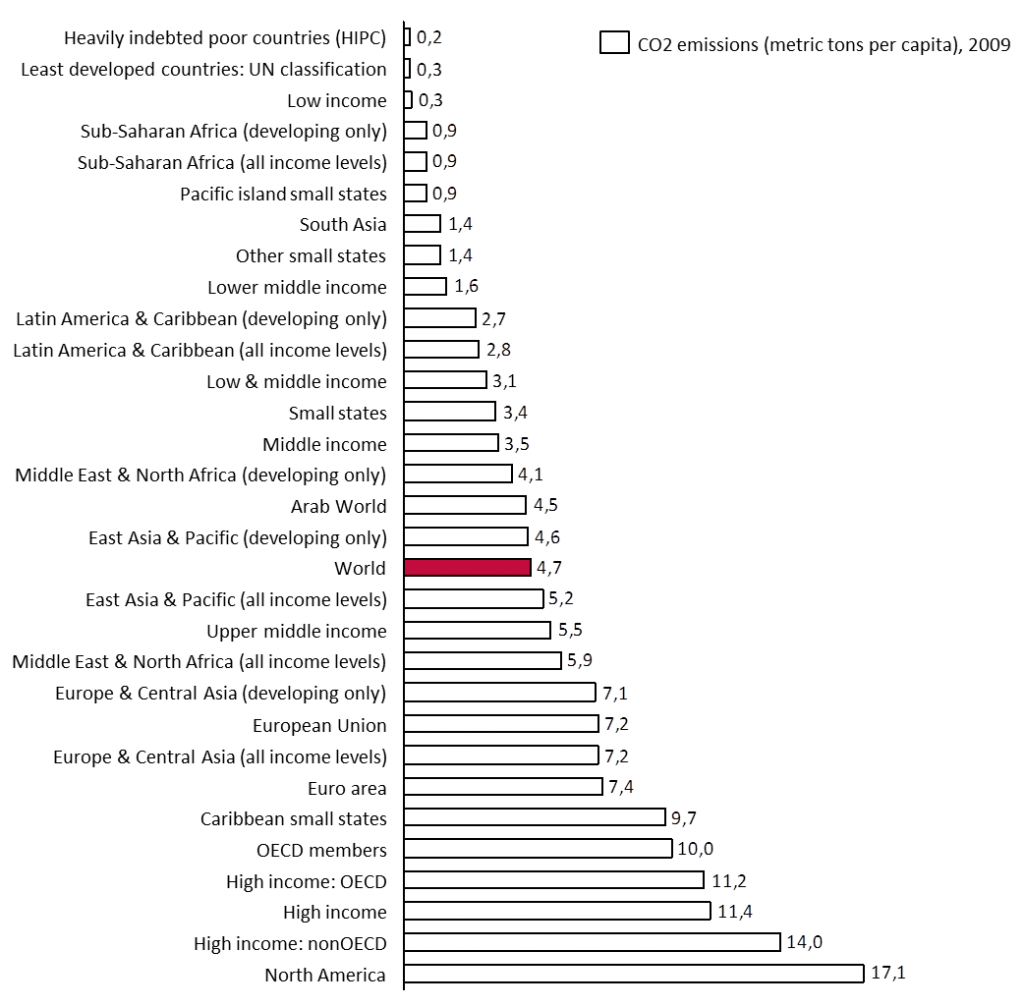
One way of looking at CO2 emissions in order to compare how different countries and regions actually are contributing to them is to look at the average CO2 emissions per capita, measured in metric ton. The overall average in the world is 4.7 metric tons per capita, but the regional breakdown is significant. In South Asia and Sub-Saharan Africa, the average CO2 emission per capita is around 1 metric ton, while in North America, the average CO2 emission per capita is 17. Even a comparison of the average emission levels in developed regions reveals that North America has by far the highest levels. The European Union has 7.2 metric tons per capita per year, followed by the Euro area with 7.4, and the OECD members at 10.
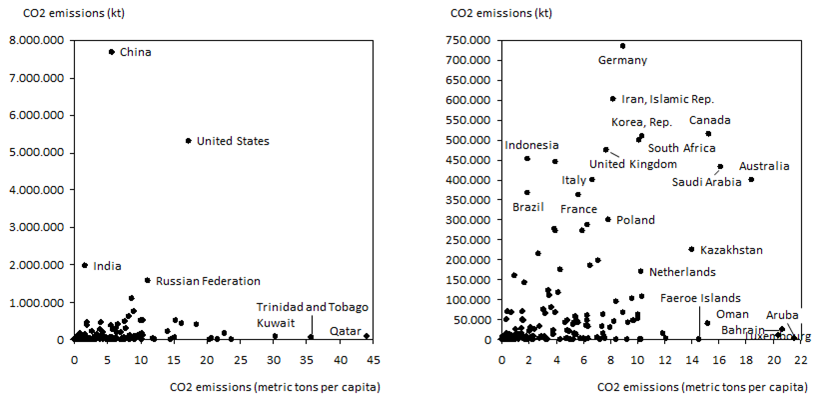
When comparing CO2 emissions, we could look at the total sum of CO2 emissions per year compared with the average CO2 emissions per capita. Such a comparison shows that China is actually the largest contributor to CO2 emissions in the world, but this is primarily due to the population size of the country rather than the average omission per capita. The United States has a high total CO2 emission rate and high emissions per capita. While there are many countries with higher average emissions per capita than United States, they are relatively small in population. By omitting countries with a total emissions greater than 1,000,000 kt CO2 and those with average CO2 emissions above 22 metric ton per capita, we can assess the spread of the remaining countries. Of these countries, Germany, Iran, Canada, Australia, Saudi Arabia, South Africa, South Korea, and the United Kingdom come out as especially interesting from a CO2 emissions perspective given their current contribution to global CO2 emissions.
Overall, the largest contributor to global CO2 emission is China, with more than 25 percent of the world’s total emissions in the world, followed by the United States with 18 percent of total emissions, India with close to 7 percent, and the Russian Federation with 5 percent.
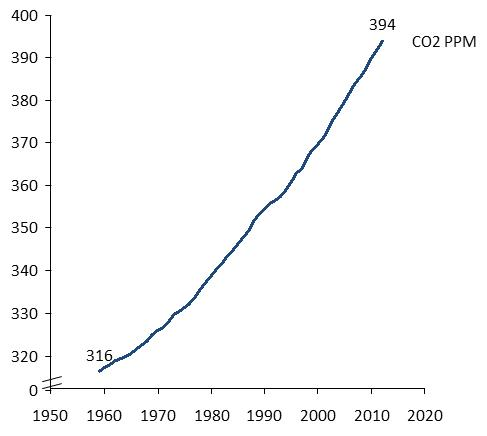
Another way to look at the current situation of CO2 emission is to examine CO2 concentration in the atmosphere (rather then total emission). This is done by the National Oceanic & Atmospheric Administration at the Mauna Loa Observatory in Hawaii; concentration is measured in PPM (parts per million).
As a context when looking at the graph below showing annual mean of CO2 concentration in PPM, many researchers believe that the upper safe limit for CO2 concentration is 350.
Possible future scenarios
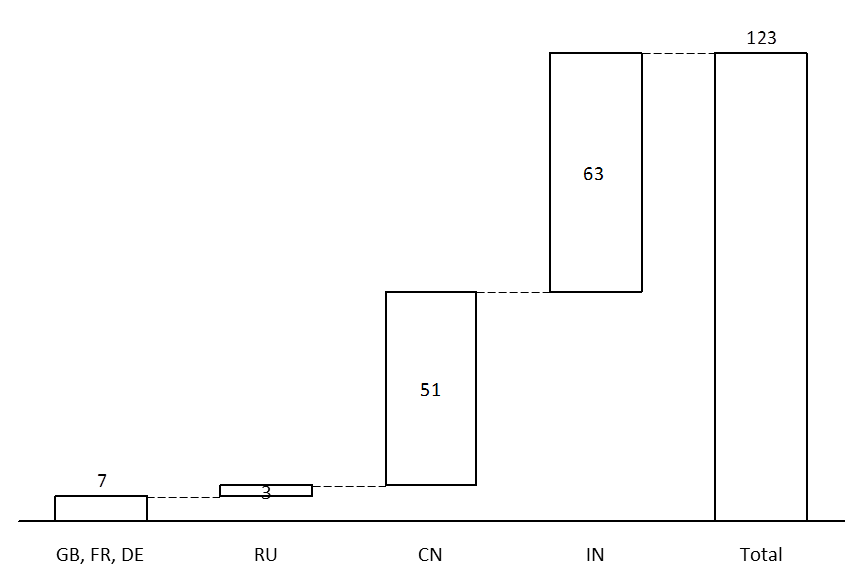
The key question is whether the development of CO2 emissions is sustainable over time. In order to try answer this question, we suggest viewing global CO2 emissions based on four simple scenarios based on development of the average CO2 emission per capita in selected markets. In scenario 1, we assume that United Kingdom (7.7 metric tons of CO2 emitted per capita per year), Germany (9.0) and France (5.6) reach the same level as the United States; that is, 17.2 metric ton. In scenario 2, we assume that the Russian Federation (11.1) reaches the same level as the US. In scenario 3, China (5.8) reaches the same level as the US; and in scenario 4, India (1.6) reaches the level of the US. None of the scenarios assume any other changes among the other countries regarding average CO2 emission per capita, including no changes for the United States itself. Furthermore, no underlying population growth is factored into the different scenarios.
In scenario 1, global CO2 emissions would increase by 7 percent, compared to 3 percent in scenario 2, 51 percent in scenario 3, and 63 percent in scenario 4. If all of the countries (United Kingdom, Germany, France, Russian Federation, China, India) reach the same level as the United States, the global CO2 emissions would increase by 123 percent – or an additional 39,532,596 kt of CO2 – to total 71,574,842 kt. On this basis alone, it is safe to assume that global CO2 emission levels and their development should be taken seriously.
Energy use drives CO2 emissions
In order to try to understand what really drives CO2 emissions, we assessed the correlation of energy use versus CO2 emissions and found, unsurprisingly, that there is a very strong correlation between energy use and CO2 emissions. Consequently, the more energy that is used, the more CO2 is emitted. The graph below shows the correlation between CO2 emission (kt) and energy use (kt of oil equivalent) for all countries measured in 2009. Here, energy use refers to the use of primary energy before transformation to other end-use fuels, which is equal to indigenous production plus imports and stock changes, minus exports and fuels supplied to ships and aircraft engaged in international transport.
As this simple assessment shows, more than 95 percent of the variations in CO2 can be explained by energy use differences.

A comparison of average energy use per capita also reveals large differences between countries. Every person in North America uses an average of more than 7000 kg of oil equivalents every year, compared with the global average of 1851 kg.

To make the differences even more clear, an average person in the United States uses as much energy (7069 kg oil equivalent per year) as 34 average people in Bangladesh.

Economic growth as the key driver of increased CO2 emissions
As a next step towards assessing the root cause for the rapid growth in CO2 emissions, we looked at the correlation between economic growth and energy use. A country’s GDP is often used as a measure for its wealth. Therefore, a key question is whether increasing wealth – that is, growing GDP – is directly translated into growing energy use and, consequently, growing CO2 emissions.
An assessment of the correlation between GPD (current, MUSD) and energy use (kt of oil equivalent) in the figure below revealed an interesting pattern. There is indeed a correlation between GDP and the energy used to achieve that GDP; however, there are some important differences between the countries.

There are differences in how much energy is used in order to achieve corresponding GDP levels. The less-developed countries typically consume proportionally more energy to achieve their level of GDP; that is, they are positioned above the trend-line in the two graphs below (in the second graph, the United States, China, India, the Russian Federation and Japan have been omitted). Some of the well-developed countries, such as Canada, are above the trend-line; that is, they use proportionally more energy to produce their level of GDP compared to the average.
Impact energy mix to reduce use of fossil fuels
Although the issue with increasing CO2 emissions has been widely accepted and debated for many years, the emissions continue to increase. Consequently, more needs to be done in order to tackle the issue. One of the most widely discussed opportunities is to shift energy production away from fossil fuels that are typically the cause of CO2 emissions. This specific issue is what has been debated widely and openly in political forums and by many different NGOs.
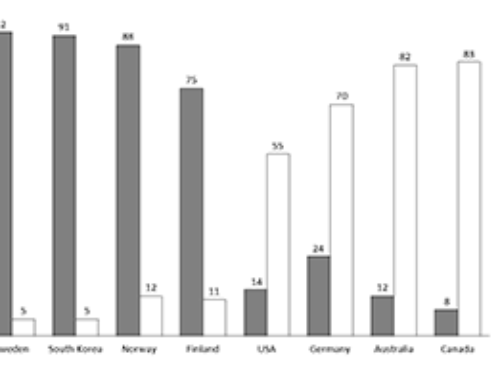
As of 2010, more than 80 percent of energy consumption still came from fossil fuels; that is, coal, oil, petroleum, and natural gas products. North America and the East Asia and Pacific regions are on par with the global average, while the European Union is clearly below the global average and the Middle East and North Africa region is above the global average.

From a historic perspective, it is interesting to see whether all of the efforts that go in to the debate on shifting energy production to alternative sources actually have any effect. The figure below indicates that they do, but only in some markets. Looking from a global average perspective, the development is not that impressive, and certainly not enough to compensate for the growing CO2 emissions. While the European Union and North America have managed to reduce the use of fossil fuels, the Middle East and North Africa region, and East Asia and the Pacific have at the same time actually increased use of fossil fuel. The total sum of these development, therefore, is pretty much a flat global average. Naturally, the debate about energy mix with the ambition of reducing the use of fossil fuel must continue, perhaps with even more emphasis than before, but it is not enough to compensate for the increasing CO2 emissions.

Energy productivity is essential in order to address the CO2 emission issue
At 2by2, we believe that one issue that must be discussed much more broadly and in depth in relation to the CO2 emission level is one that we call energy productivity.
Energy productivity is a concept by which we can measure how much energy we consume in order to create GDP growth. As noted above, increased energy use will lead to increased CO2 emissions, as we are not able to shift energy mix away from fossil fuel quickly enough. Some disbelievers might say that we cannot expect to continue to grow GDP at the pace we are used to, as the impact on the environment is too great; at 2by2, we refuse to agree with that conclusion at the moment. GDP growth is positive, but we must look into the prerequisites for ensuring sustainable growth, also from an environmental perspective – this is where energy productivity can be an important measure.
In 2010, the global average energy productivity was 5.5; this means that on a global level, we manage to create $5.50 per kilogram of oil equivalent.
Note! To make the comparison fair, a constant 2005 PPP dollar is used; that is, gross domestic GDP converted to a 2005 constant international dollar using purchasing power parity (PPP) rates meaning that an international dollar has the same purchasing power over GDP as a US dollar has in the United States.
The Middle East and North Africa and East Asia and the Pacific are both below the global average at $4.80 per kilogram of oil equivalent. North America is slightly above the global average at $5.80 per kg oil equivalent. The European Union has the highest energy productivity, being able to produce $8.10 GDP per kg oil equivalent.

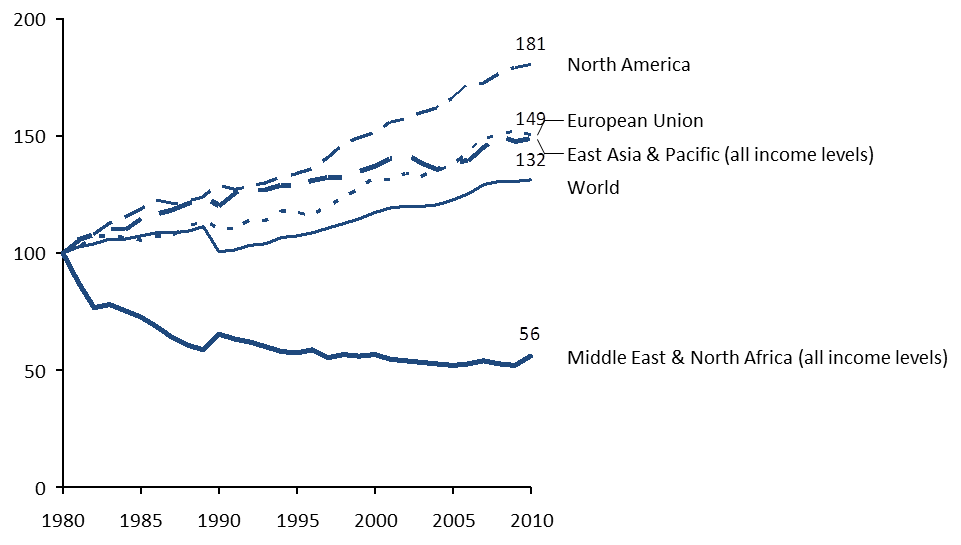
From a historical perspective, energy productivity improved from 4.2 in 1980 to 5.5 in 2010. This development has primarily been driven by positive development in the European Union and in North America. During the same period, the Middle East and North Africa decreased their energy productivity.

Indexing energy productivity in the different regions to 100 in 1980 in order to look to compare the development under this time period shows that North America has made the best progress, with an improvement in energy productivity of more than 80 percent. On a global level, energy productivity has improved somewhat more than 30 percent over 30 years.
A call for action to entrepreneurs and business leaders
From this brief article, it is fair to assume that the evolution of CO2 emissions should be taken seriously and that current efforts are unlikely to be sufficient to address this matter. The efforts that go into reducing the use of fossil fuel as a source for energy production need to continue, perhaps with even greater strength. However, there is also another opportunity that we need to leverage in addressing this issue: energy productivity.
Growth is good as it creates opportunities for increased wealth for a society at large and for individuals living in that society. However, in order to ensure that growth is sustainable, we at 2by2 believe that energy productivity needs to be worked with. We should not look at to how we can make another 30 percent improvement in the next 30 years. Instead, we should ask ourselves how we can create a step change here, how can we go from 8.1 GDP per unit of energy use in European Union to 20? This is the real challenge behind the CO2 emission issue and is something that we would encourage all entrepreneurs and business leaders to embrace and emphasize.
From a strategy perspective, we see a clear opportunity for companies taking a lead in this domain, as leadership in energy productivity could be turned into a competitive advantage for a cost leader and to increased profitability for companies delivering on it.
Sources
- Carbon Dioxide Information Analysis Center, Environmental Sciences Division, Oak Ridge National Laboratory, Tennessee, United States.
- International Energy Agency (IEA Statistics © OECD/IEA, http://www.iea.org/stats/index.asp).
- World Bank, PPP data
- Dr. Pieter Tans, NOAA/ESRL (www.esrl.noaa.gov/gmd/ccgg/trends/) and Dr. Ralph Keeling, Scripps Institution of Oceanography (scrippsco2.ucsd.edu/).

[…] June we published the article “Energy-light economic growth – a call for action” which basically was emphasizing the importance of innovation and creative thinking in the […]