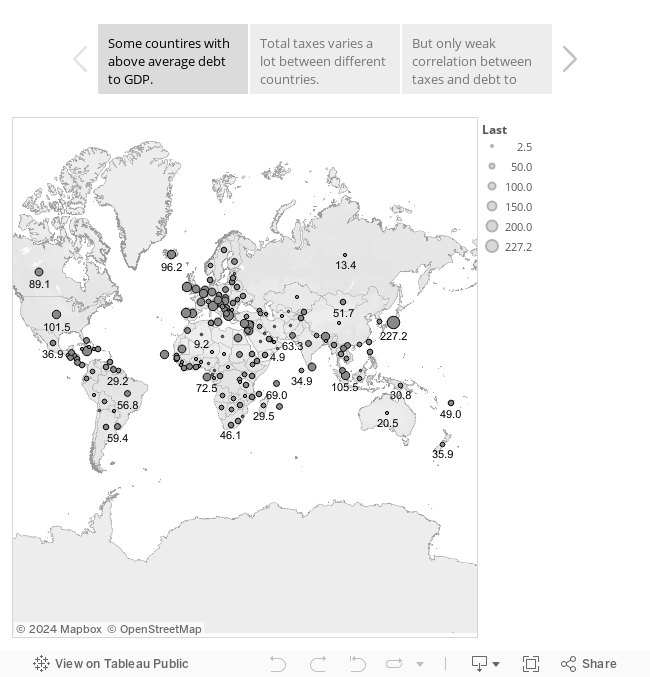
Government debt is one of the issues widely discussed among economists. A good measure for a nations current status in terms of debt is to compare it with the GDP of the country, i.e. debt to GDP comparison. By looking at that measure it is clear that all countries have very different starting position, some countries have a low debt to GDP ration while others have a ratio that goes beyond 100.
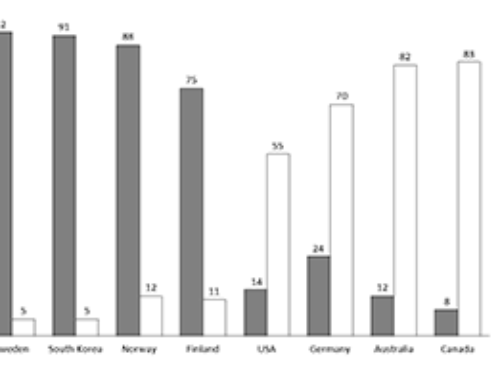
Government income mainly comes from taxes, and in this brief assessment we only looked as social security taxers, personal taxes and sales taxes (VAT). By assessing the different taxes individually it is also possible to assess the total tax pressure in each country. When doing that we made the simple assumption that all of the available net income was consumed, i.e. sales taxes applied to. Interestingly enough it turns out that there is a great spread in the total taxes, from low 30 to above 70%. This means in reality that if the employee cost for a company is 100 and the total tax rate is above 70, then the employee in reality receives a purchasing power of less than 30, the rest is taxes.
Finally we assessed the correlation between taxes and debt. Logically we wanted to understand whether taxes was used as a mean for reducing need for debt or if low taxes necessarily lead to higher government debts. It turns out that correlation between total taxes and debt is very weak, if anything there is a weak positive correlation, meaning that governments seem to increase taxes as a mean of trying to reduce government debts. This is however not true for all of the countries, e.g. US with a debt to GDP above 100 still enjoys low total tax rate of somewhat more than 40% while Sweden with low debt to GDP of somewhat more than 40% still have one of the highest total taxes of above 70%.
Have a look at the graphs below for further insights, note it is possible to interact with the graphs. Click on the different headings to see the different graphs.
Source: tradingeconomics.com
Leave A Comment